.png)
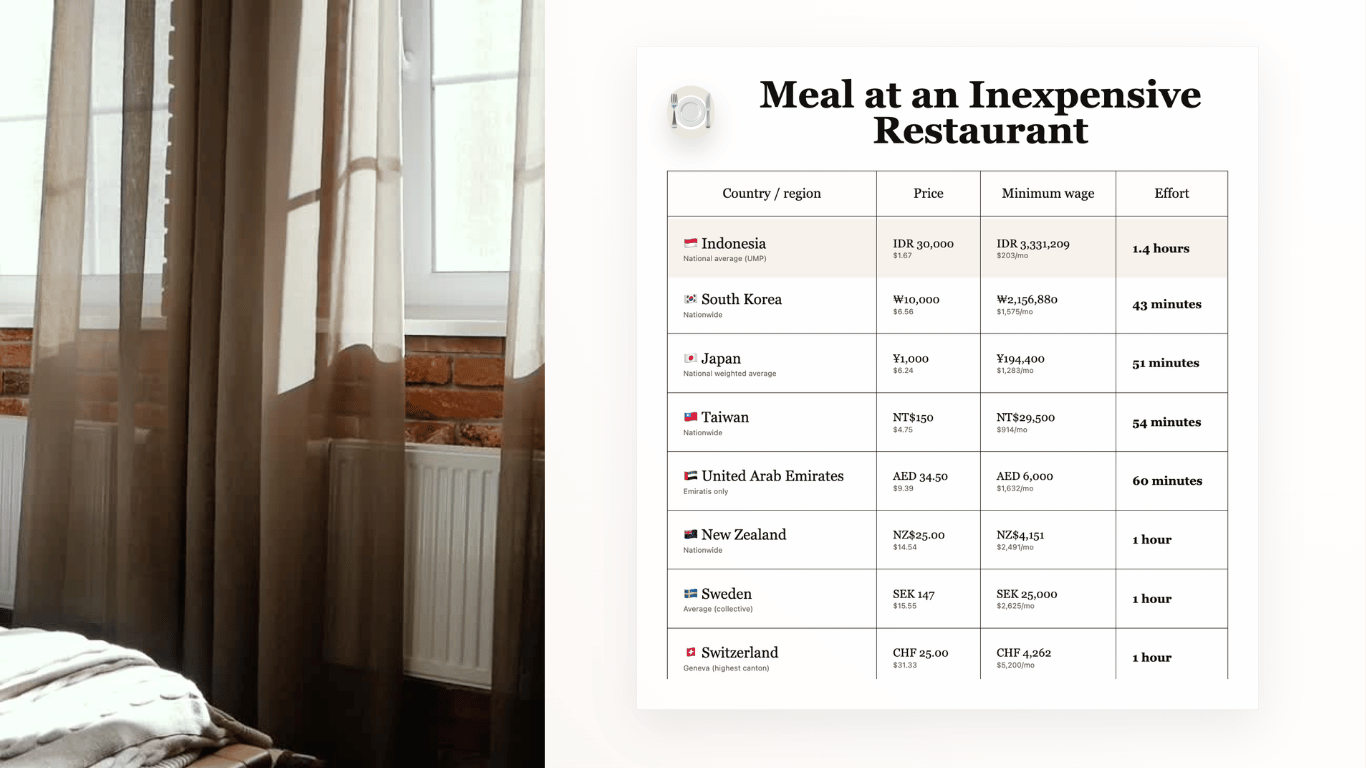
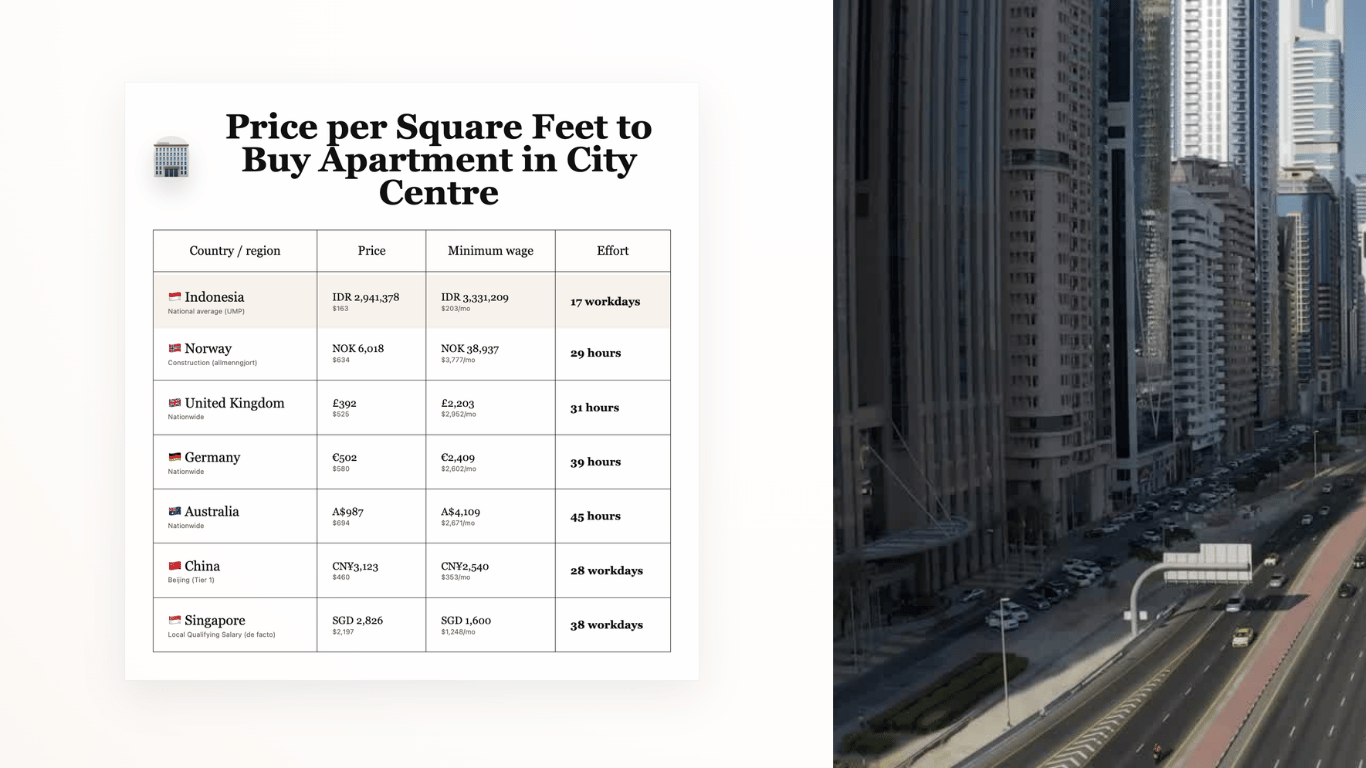
Here’s a thought that stuck in my head: a low price doesn’t always mean something is affordable. 🤔
A cup of coffee might be cheaper in one country, but take way more hours of work to pay for. Price tags alone don’t tell you that. So I built Effort to Buy (Pay-tience) to make that difference easy to see. (Yes, the name is a pun. Pay + patience. I’m not sorry 😆.)
🔎 Overview
- Goal: Turn everyday prices into estimated working time, so comparing countries actually makes sense.
- Coverage: 48 countries and 52 categories, including food, transport, clothing, housing, and utilities.
- Key features: Searchable item and country pickers, card and table views, and links to the original price and wage sources.
- Tech stack: React, Vite, CSS, CSV datasets, and Netlify for static hosting.
- Architecture: Fully client-side. No database or backend needed to crunch the numbers.
- Built in: About three days, from first commit to styled and deployed 🏃♀️.
🗺️ How Everything Connects
flowchart TD
    A[CSV data: prices, wages, flags, emojis] --> B[Vite build]
    B --> C[Static React app on Netlify]
    C --> D[Visitor's browser]
    D --> E[Select an item and countries]
    E --> F[Calculate work hours]
    F --> G[Card or table view]
All the data gets bundled into the site during the build. Once the app loads, filtering and math all happen right in your browser, with no live pricing API involved.
🔨 How It Works
-
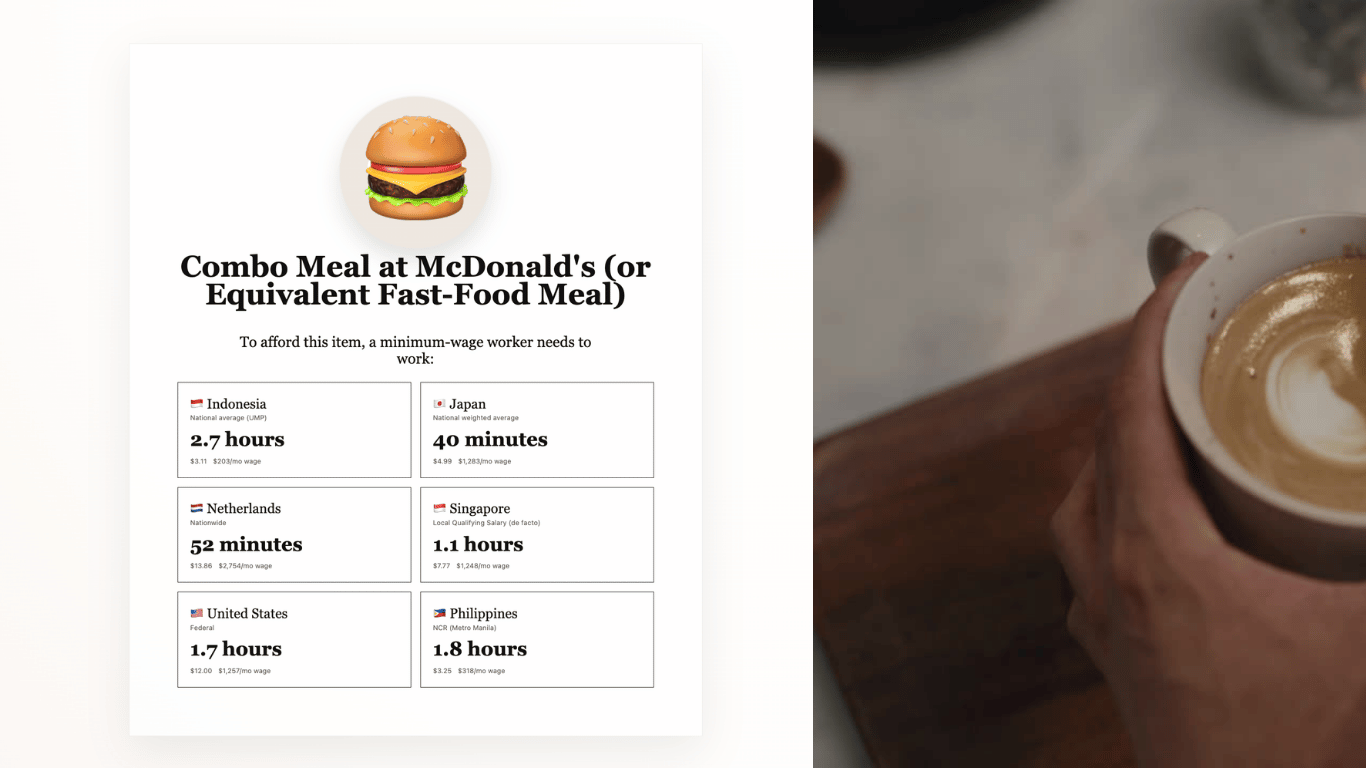
Pick an item, like a cappuccino, a meal, or a monthly transport pass. Every item even gets its own emoji ☕🍜🚌.
-
Choose countries to compare, or just keep them all. Indonesia stays pinned as my home reference.
-
Match the data: The app pairs each country’s item price with its monthly minimum wage using country IDs.
-
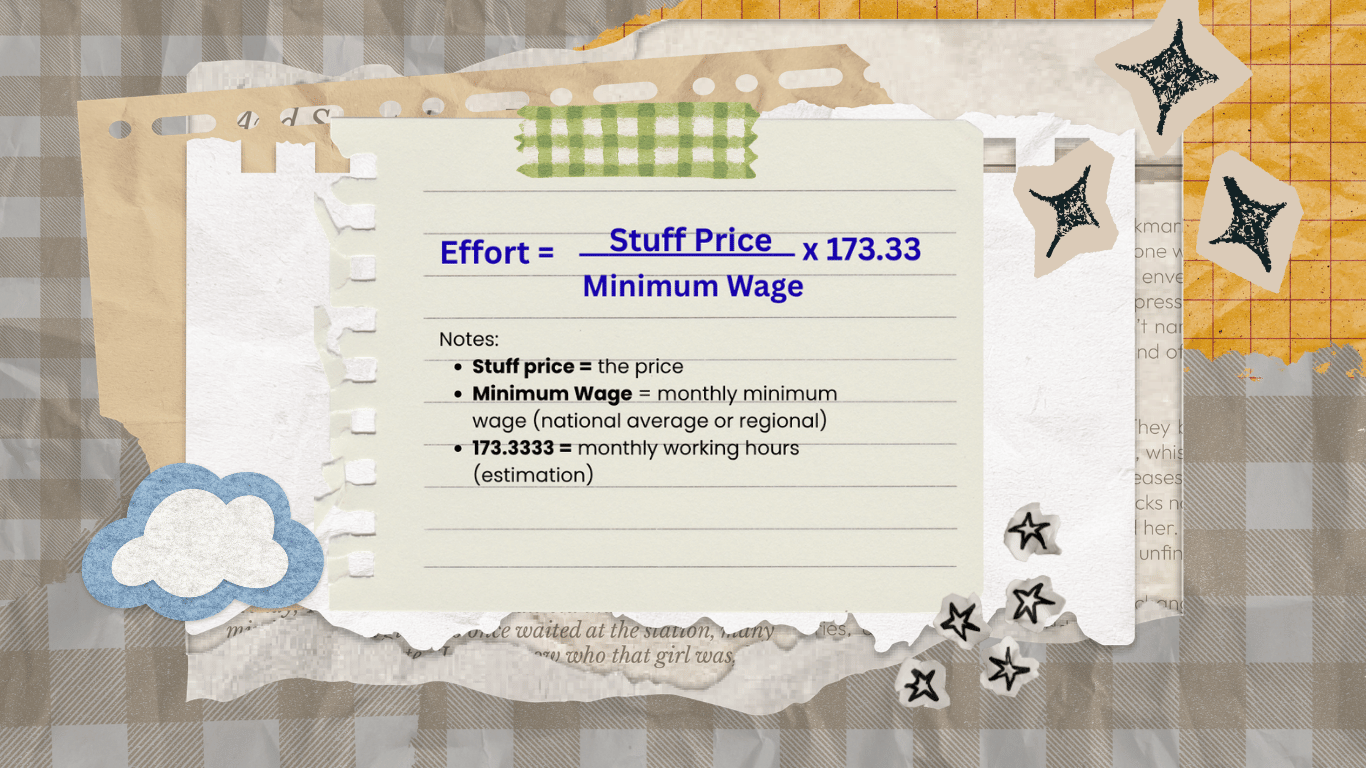
Do the math with USD-converted numbers from the dataset:
Work hours = (Item price in USD / Monthly minimum wage in USD) × 173.33Where does 173.33 come from? It assumes 40 hours a week: 40 × 52 weeks ÷ 12 months ≈ 173.33 hours per month.
-
See the results: Card view shows up to 12 comparisons. Table view shows everything, including local prices, wages, and source links. Results are sorted by effort, with Indonesia always first.
Show your sources! I really wanted the numbers to be checkable. Click a country name to open its minimum-wage source, or click an effort value to open the item-price source, both in a new tab.
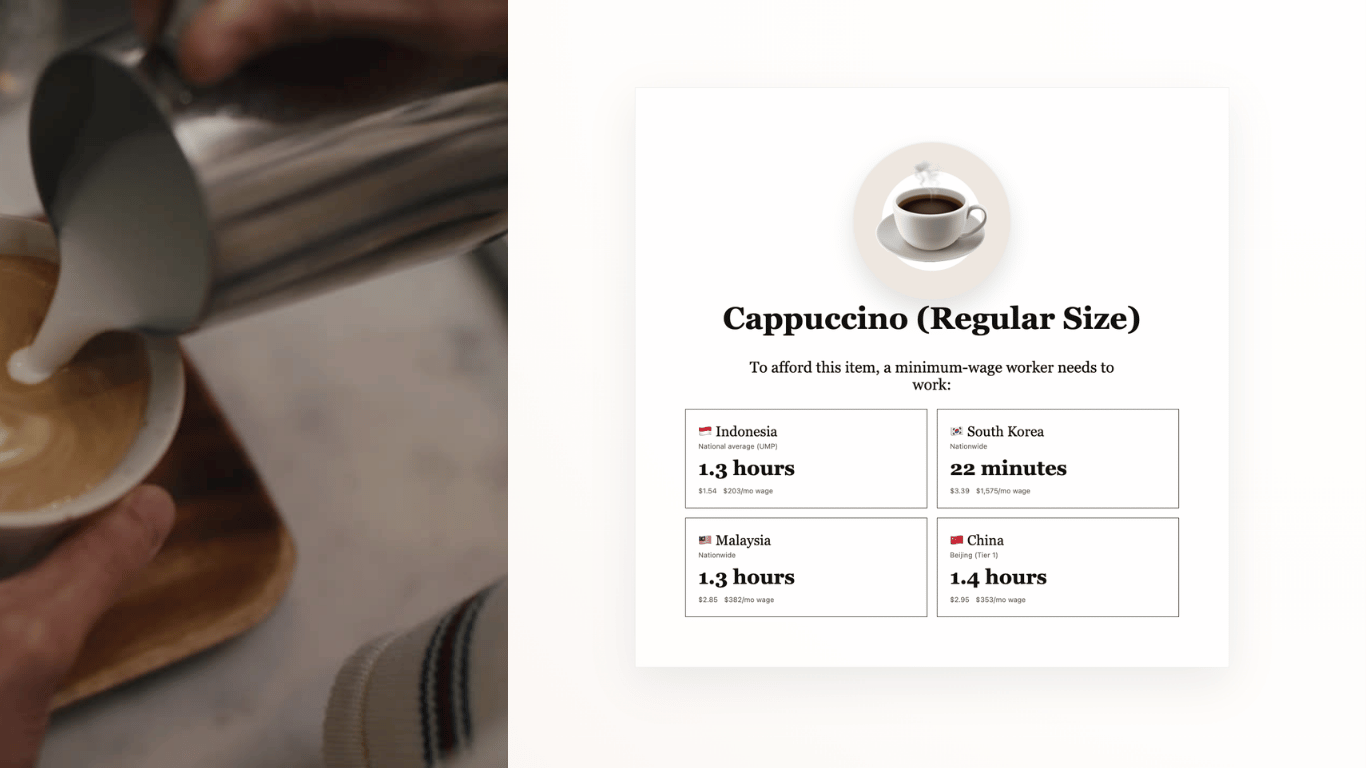
☕ Example: How Much Work Does a Cappuccino Cost?
| Country | Cappuccino price | Monthly minimum wage | Estimated work |
|---|---|---|---|
| Indonesia | $1.54 | $203 | 1.3 hours |
| United States | $5.42 | $1,257 | 45 minutes |
So the cappuccino is cheaper in Indonesia, but takes almost twice as long to earn on minimum wage. That’s exactly the kind of thing this app is for!
Figures come from the app’s dataset dated June 10, 2026. They’re here to show the calculation, not a live price quote.


🤔 Decisions I Made (and What They Cost)
| Area | Decision | Why it works | Trade-off |
|---|---|---|---|
| Data | Bundle CSV files with the app | Simple setup; no database or live data API | Refreshing the figures requires a new build |
| Affordability | Compare work hours, not just prices | Gives a more relatable cross-country comparison | Minimum wage doesn’t reflect everyone’s income |
| UI | Provide card and table views | Quick scanning or detailed comparisons | Cards show only the first 12 results |
| Transparency | Link results to wage and price sources | Readers can check where the numbers came from | Source data and methodologies may change |
💸 Cost & Performance
A static React app fits this perfectly. Netlify serves the site, and your browser does the math. So there’s no server work or database hit for every comparison.
The one thing to watch as it grows: every visitor downloads the CSV data. Smaller datasets, validating data when updating it, or loading data in chunks would help keep it snappy.
⚠️ What the Numbers Don’t Tell You
These are helpful estimates, but not a full cost-of-living measure:
- Minimum wages can differ by region, type of worker, and local rules.
- The math ignores taxes, take-home pay, and personal expenses.
- Prices and exchange rates change. The dataset is a dated snapshot, not real-time info.
💬 Closing
Two price tags can look super different, but working time adds a whole new perspective. Effort to Buy turns that idea into something simple you can explore yourself.
Go check how many hours your favorite snack costs around the world 🌍